Academic Self-Concept Project
Overview
Background
One part of James Daniel Lee’s argument in Which Kids Can “Become” Scientists? Effects of Gender, Self-Concepts, and Perceptions of Scientists is that girls are less likely to pursue science careers because they feel their self-concept(s) are not in line with the expectation of what a scientist is like. This suggests that, at least in part, students tend to pursue careers which they feel are congruent with their self-concept. However, this view does not account for whether college students consider their education a means to pursue their passions and express a part of their “true” self, or as a path to obtaining a lucrative career. Further, research on academic self-concept almost exclusively focuses on achievement as its main indicator or correlate.
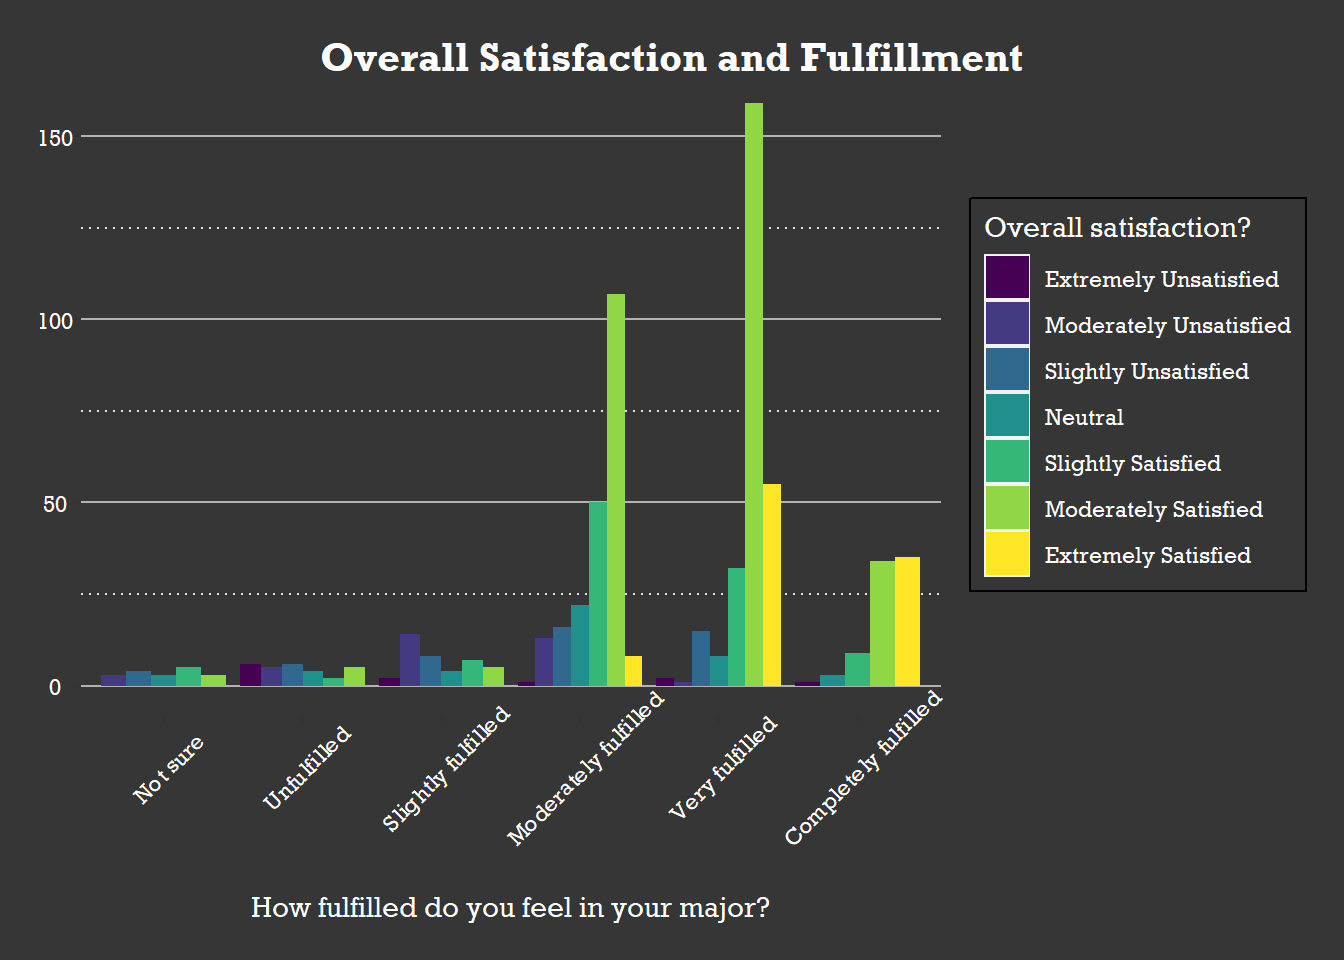
I argue that achievement is only one aspect of academic self-concept and research on this topic must account for academic gratification. That said, I seek to (1) examine whether students college major is more influenced by careerist goals or self-concepts, (2) explore how others’ perceptions (reflected appraisals) affect their self-concept and overall satisfaction with their major, (3) reveal if students who choose their major based on self-concept are more or less satisfied with their major, and (4) investigate students’ attitudes about their perceptions of their future success as it relates to the conclusions above.
Research Questions
- What is the role of self-concept in students’ choice of college major?
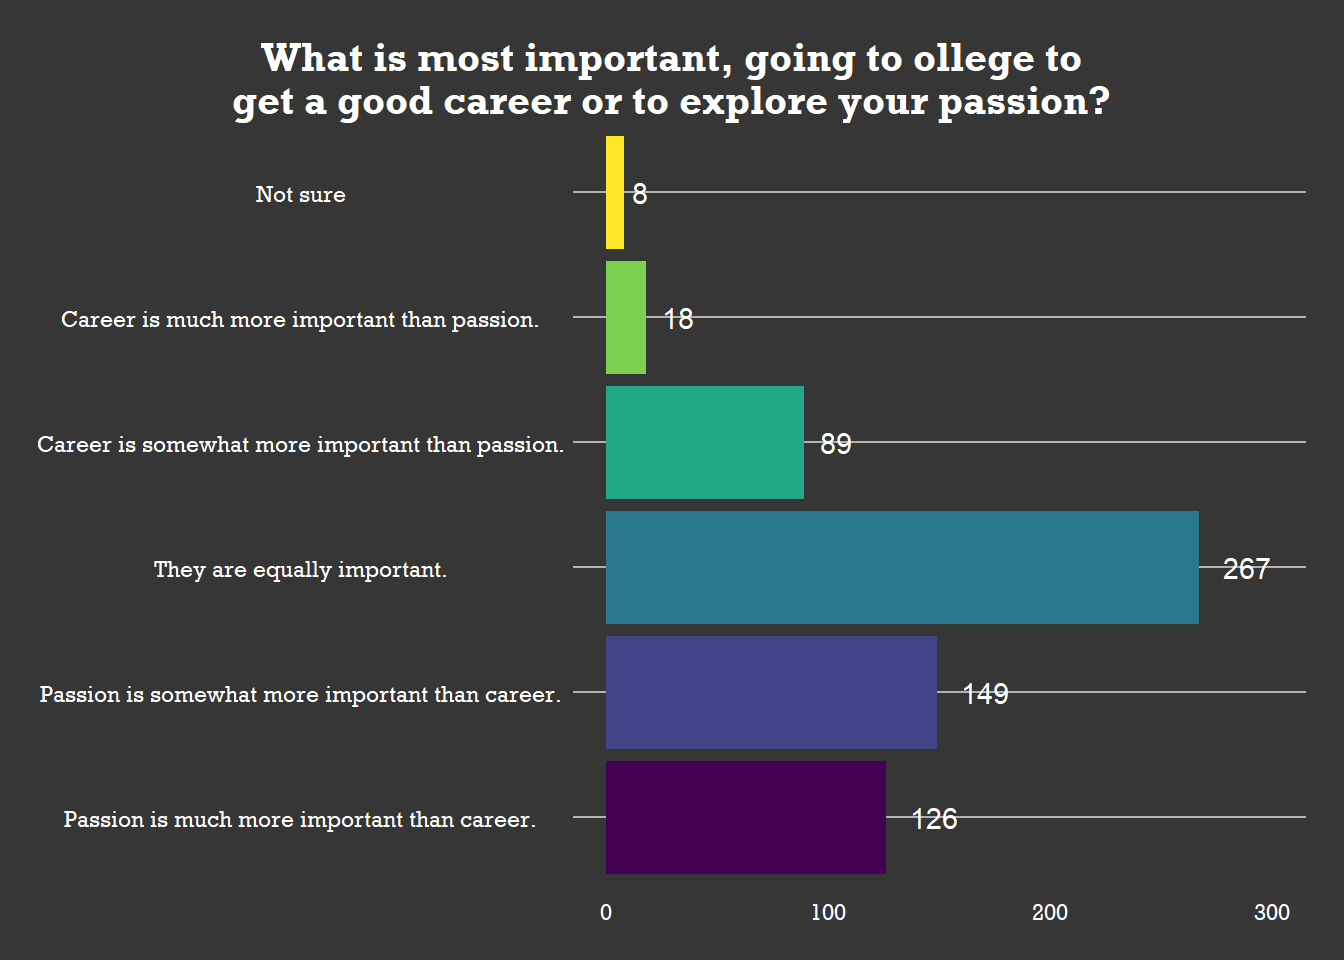
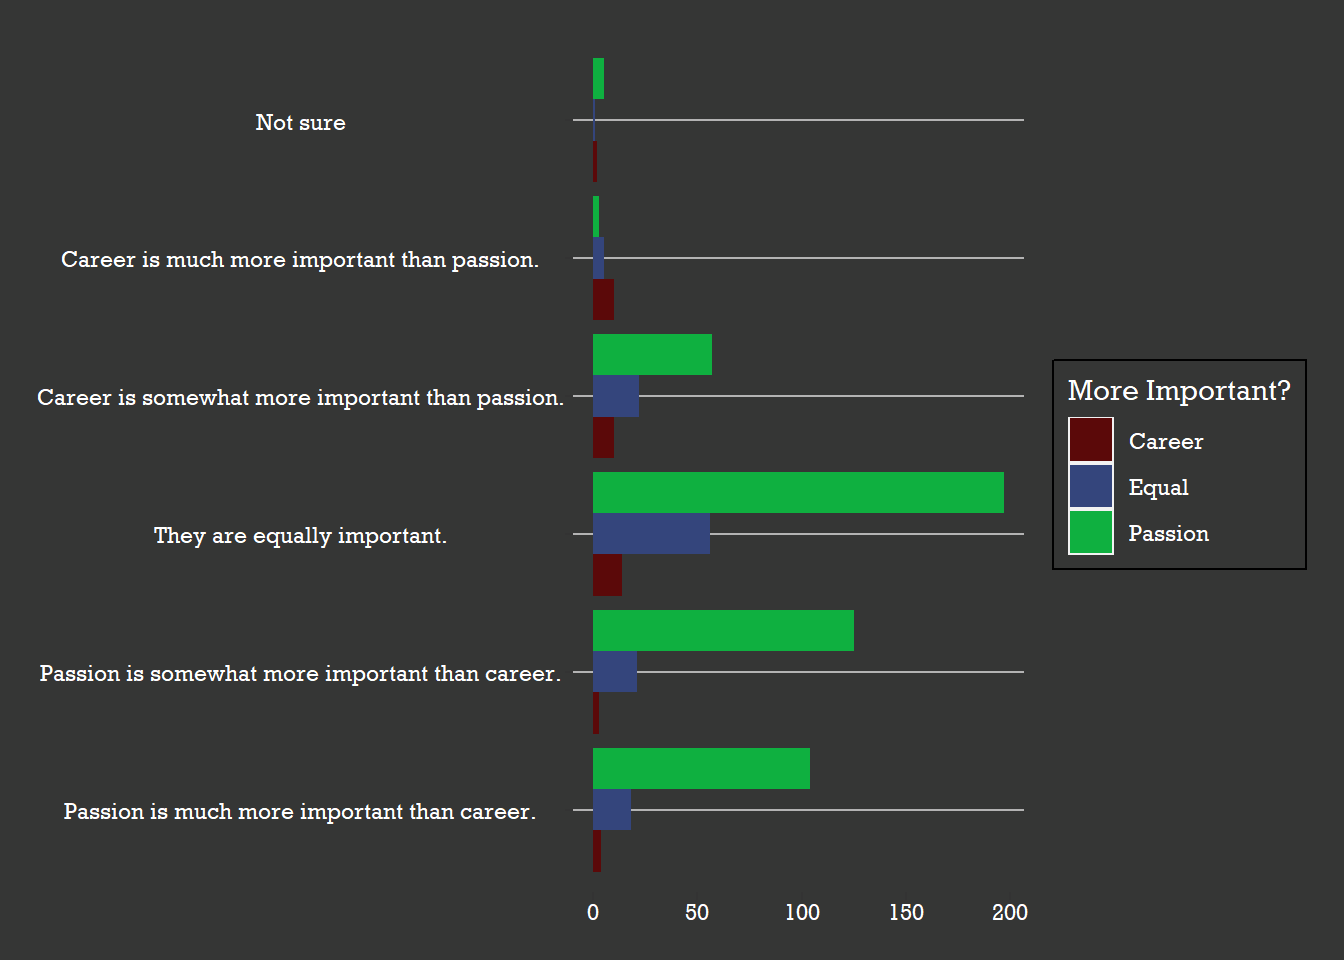
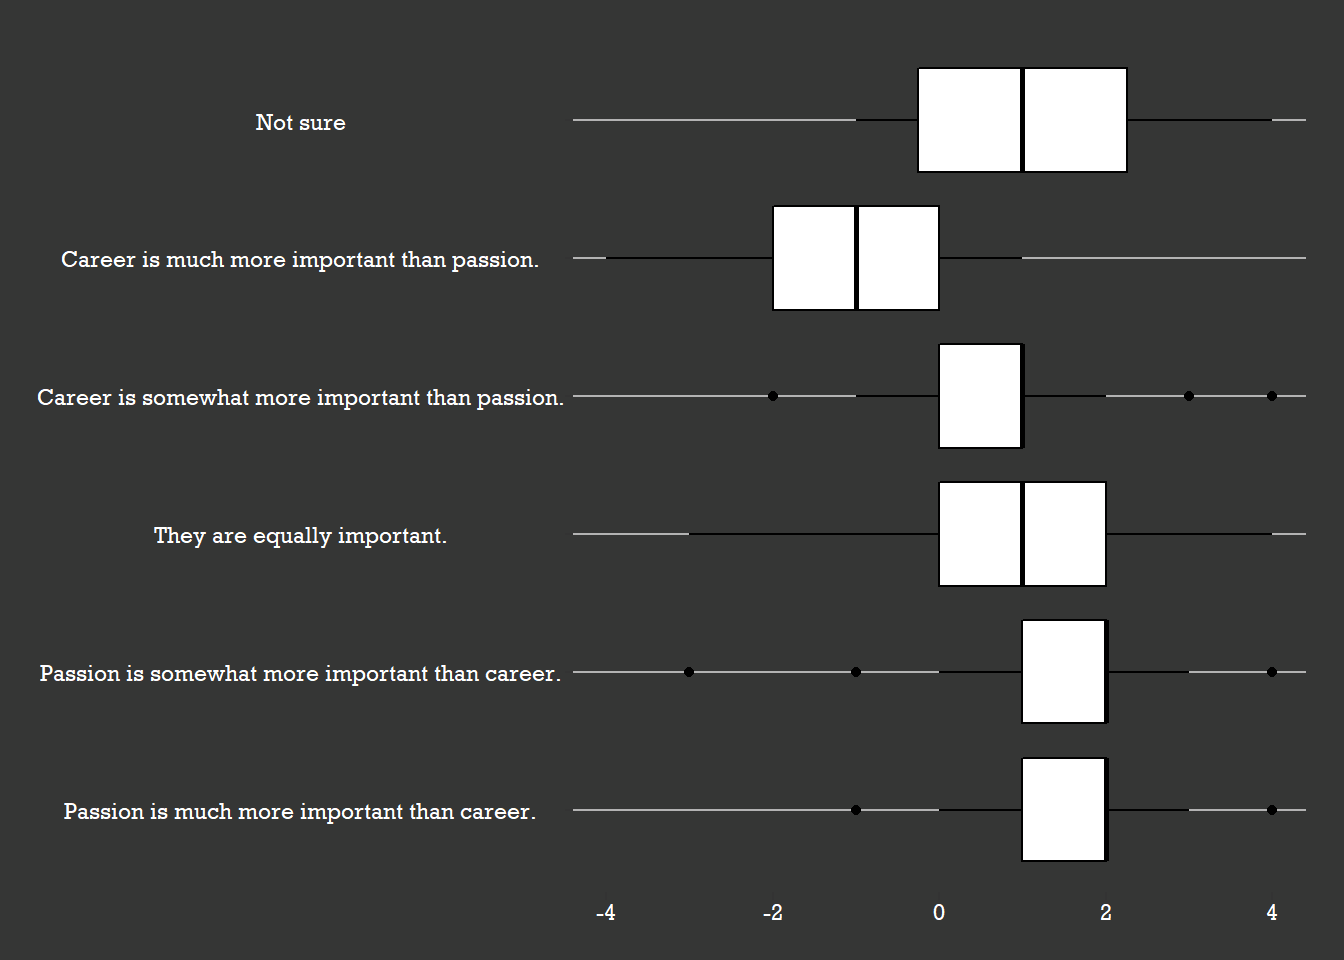
- Are students more likely to choose a major based on self-concept or career outcomes?
- Are students who choose a major based on self-concept more or less satisfied than those who choose a major on career outcomes?
Methods
- Survey undergraduate students on academic self and careerism
- Focus on the parts of academic self literature ignores
Survey
Download the survey here.
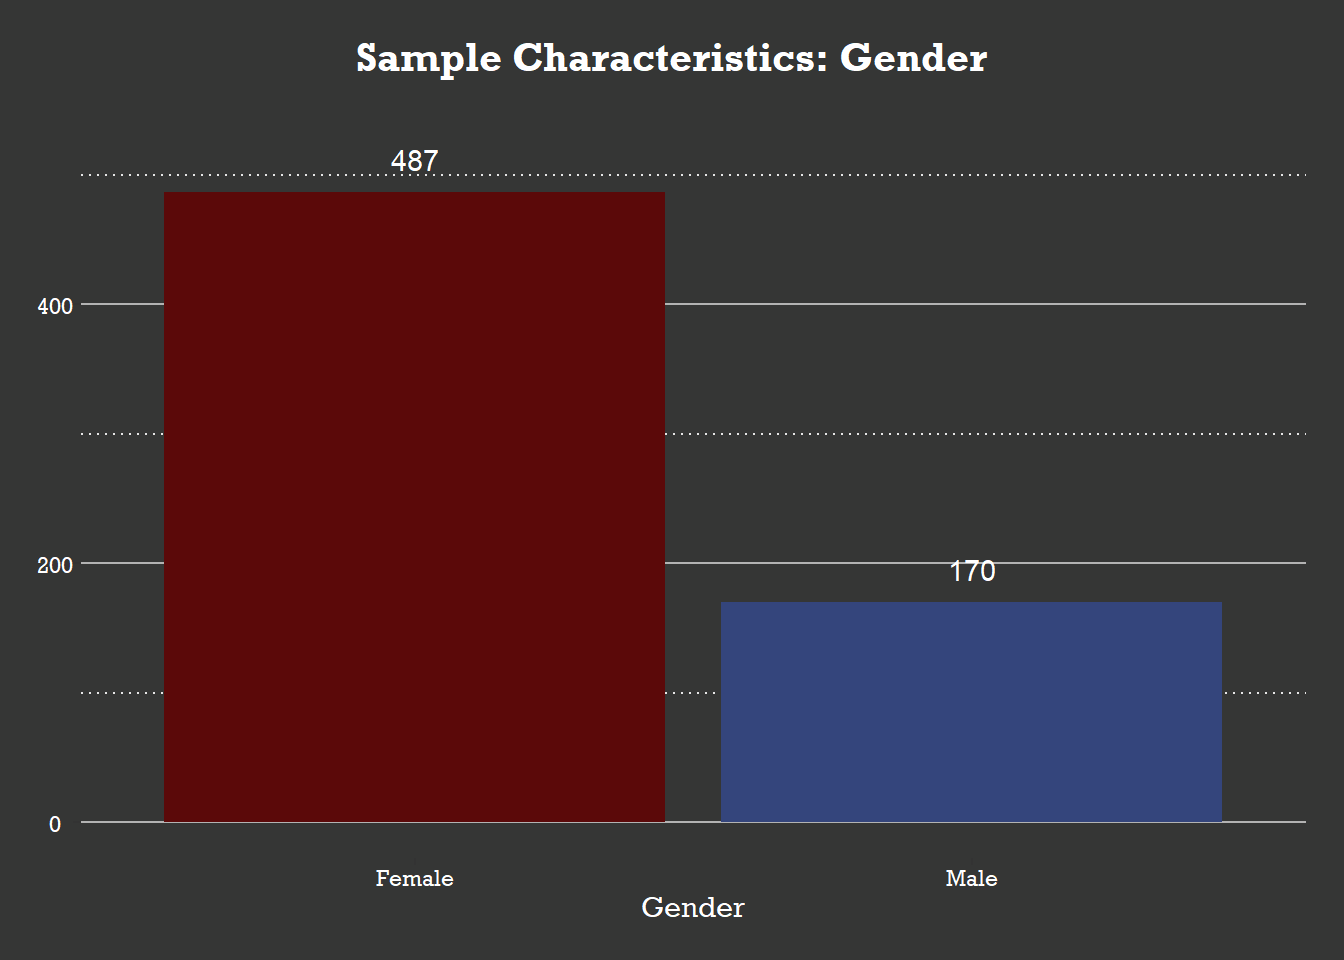
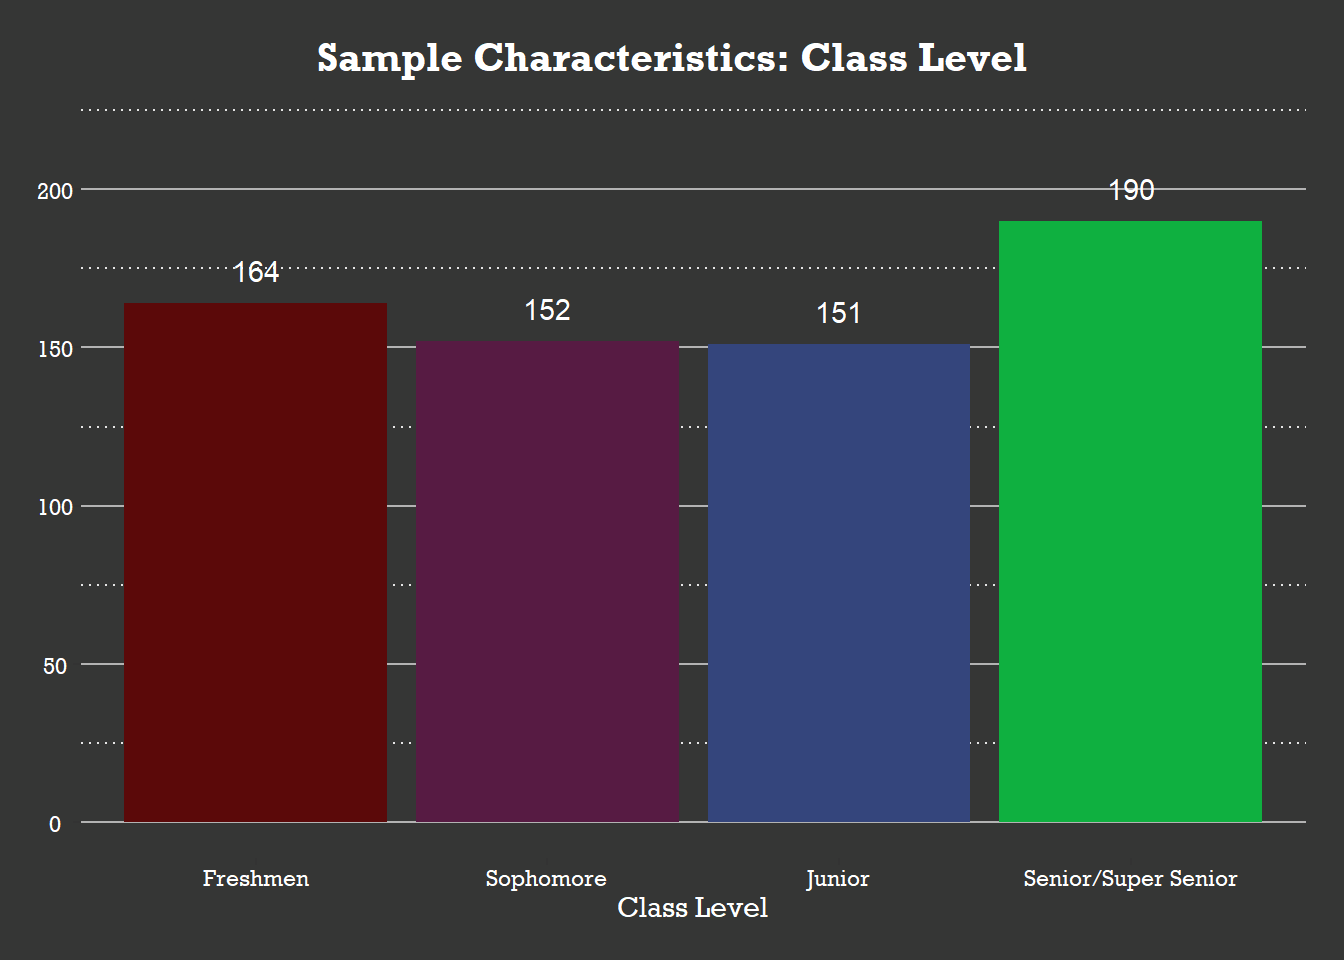
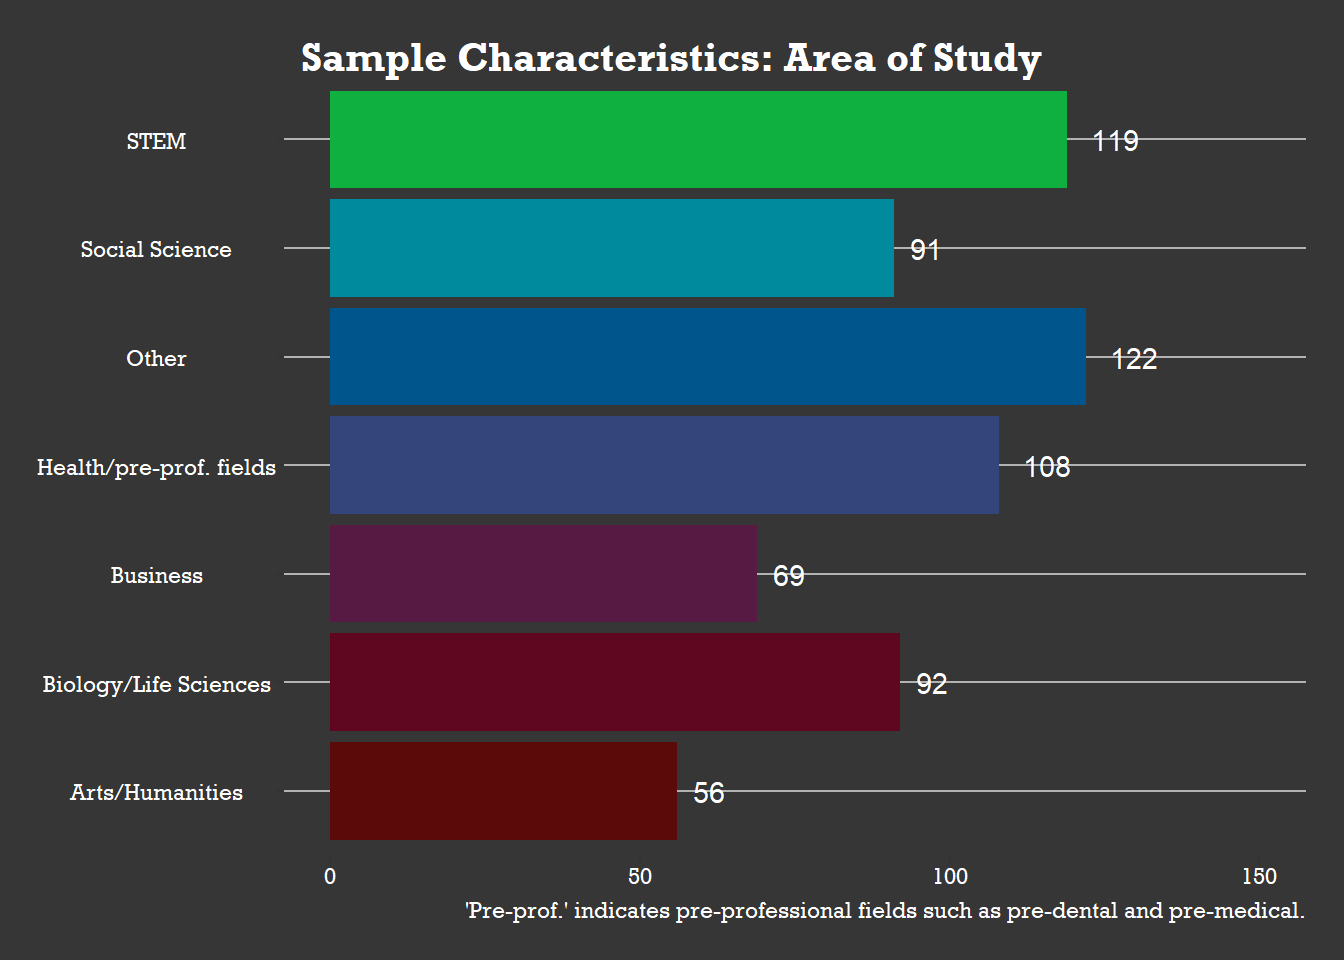
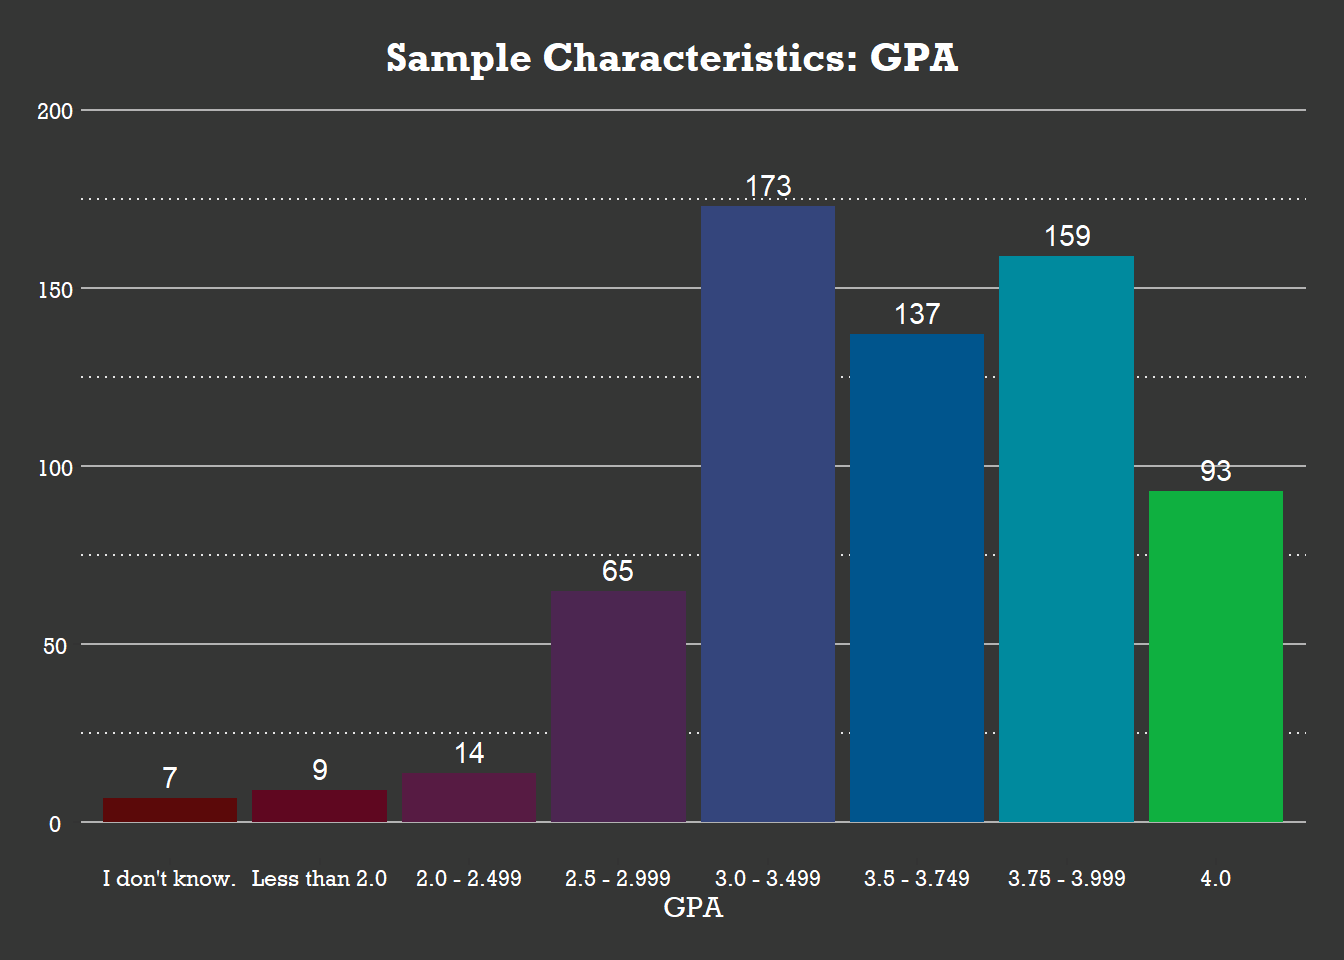
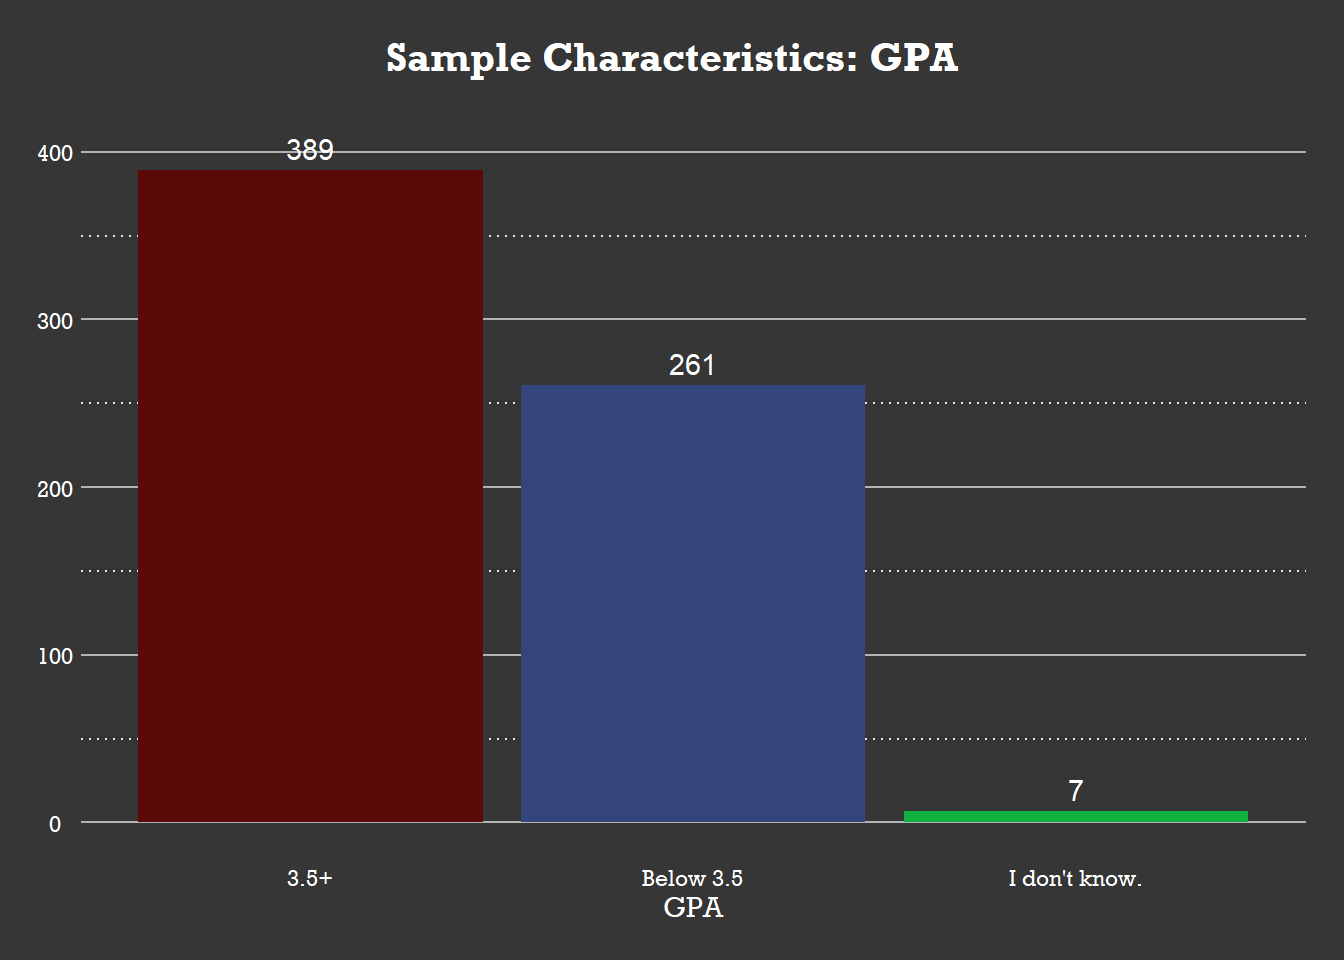
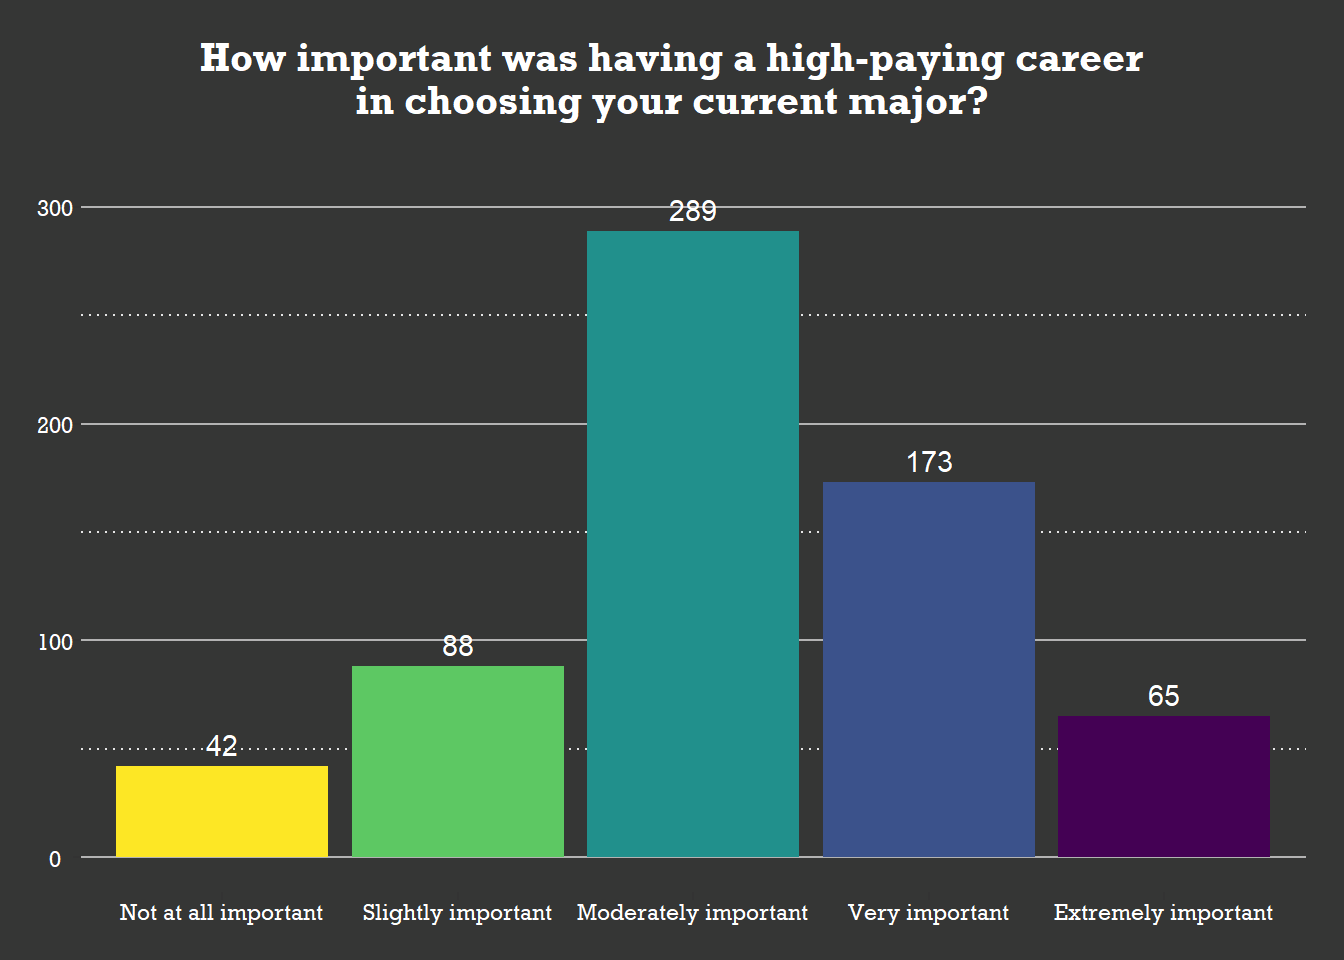
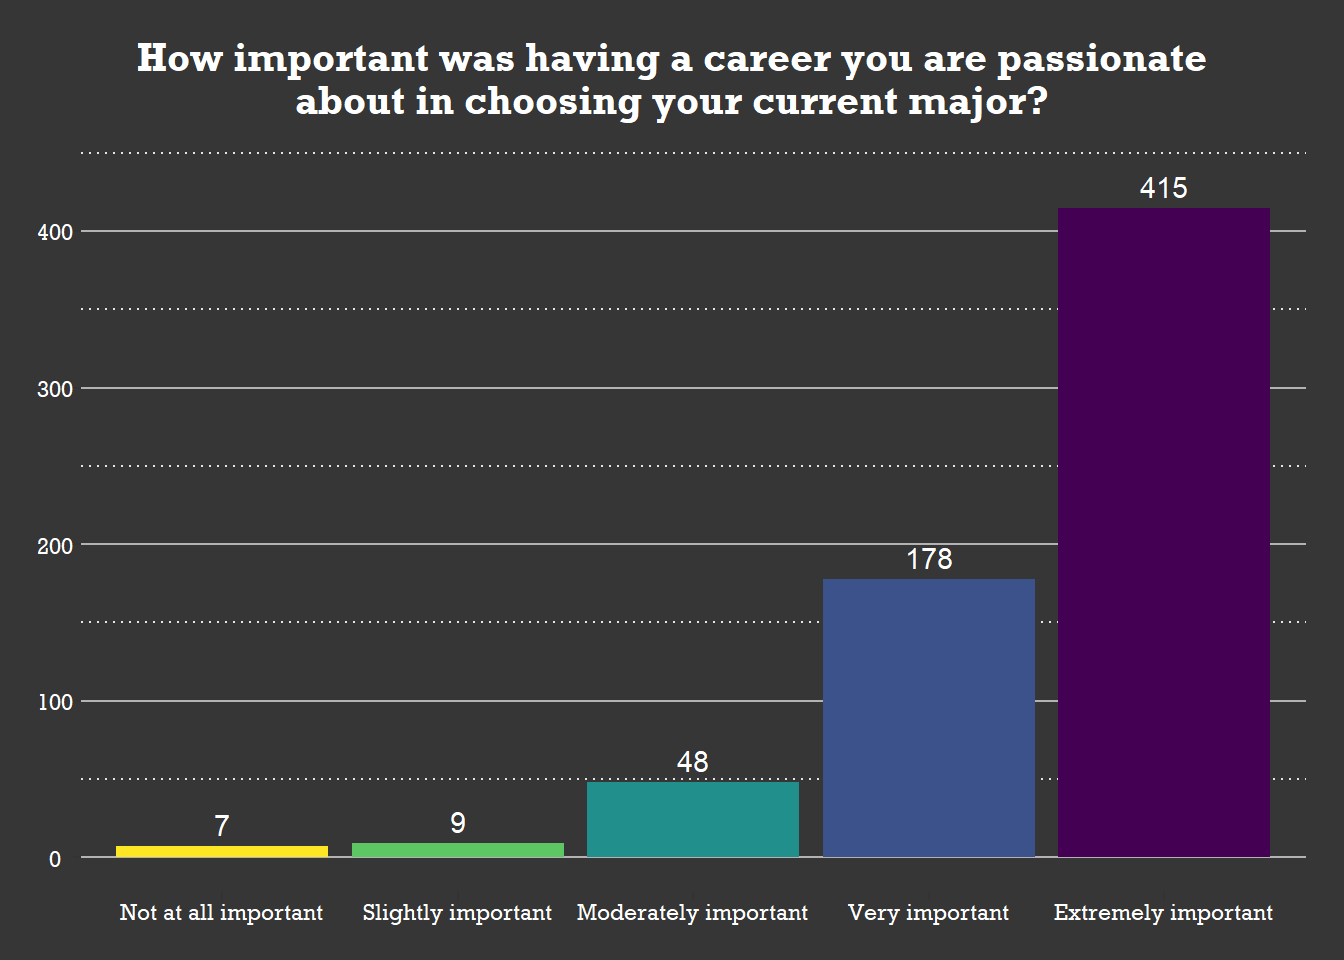
Sample Characteristics
Analysis
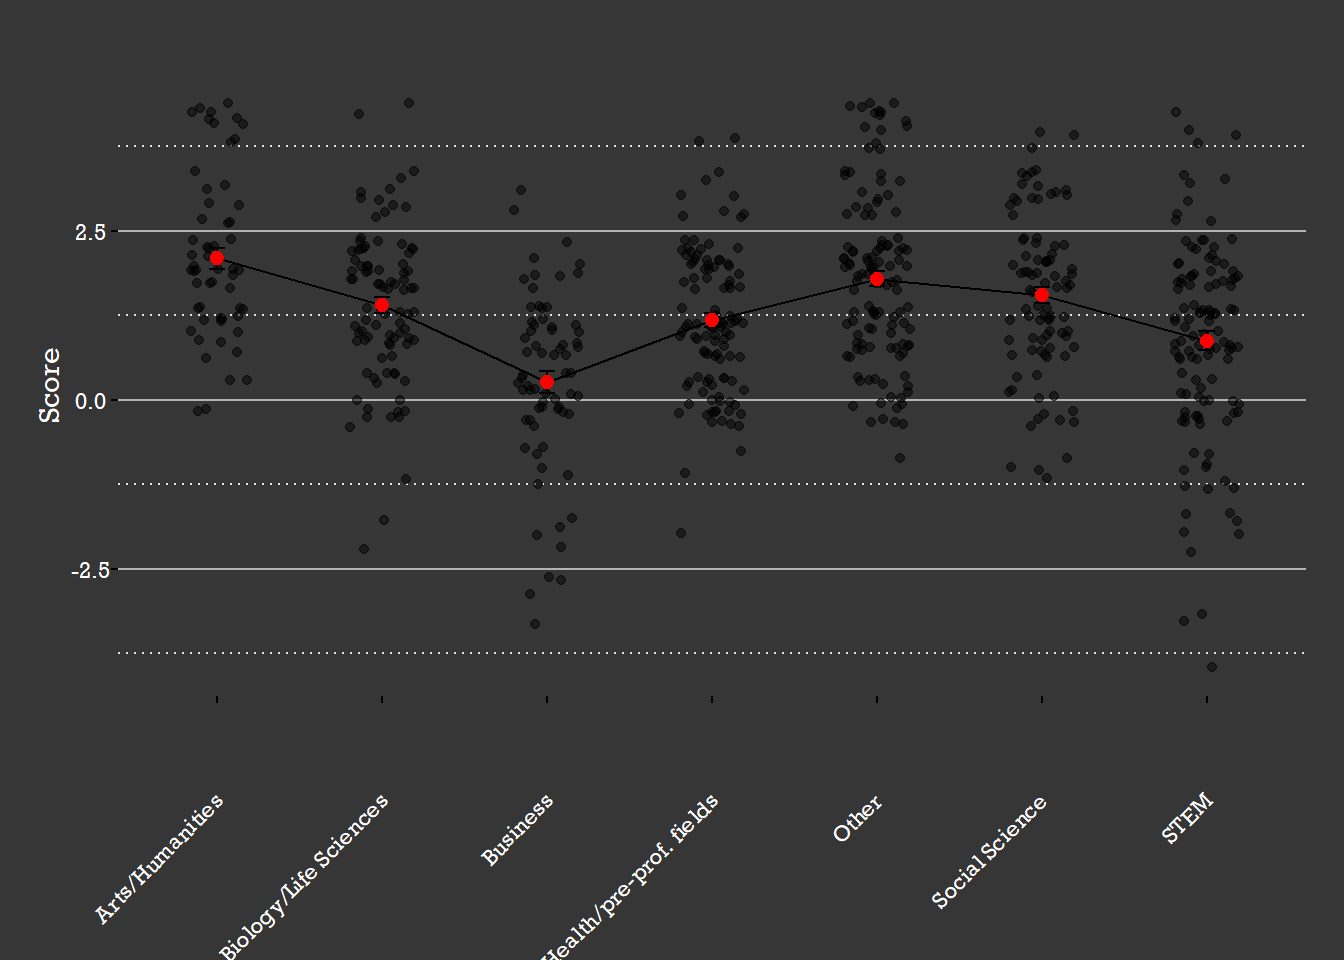
| Major? | n | mean | sd | stderr | LCL | UCL | median | min | max | IQR | W.Stat | p.value |
|---|---|---|---|---|---|---|---|---|---|---|---|---|
| Arts/Humanities | 56 | 2.09 | 1.20 | 0.16 | 1.77 | 2.41 | 2 | 0 | 4 | 2.00 | 0.8983 | 0 |
| Biology/Life Sciences | 92 | 1.40 | 1.13 | 0.12 | 1.16 | 1.64 | 2 | -2 | 4 | 1.00 | 0.9151 | 0 |
| Business | 69 | 0.26 | 1.36 | 0.16 | -0.06 | 0.58 | 0 | -3 | 3 | 1.00 | 0.9111 | 0 |
| Health/pre-prof. fields | 108 | 1.18 | 1.08 | 0.10 | 0.98 | 1.38 | 1 | -2 | 4 | 2.00 | 0.9184 | 0 |
| Other | 122 | 1.79 | 1.23 | 0.11 | 1.57 | 2.01 | 2 | -1 | 4 | 1.75 | 0.9175 | 0 |
| Social Science | 91 | 1.55 | 1.16 | 0.12 | 1.31 | 1.79 | 2 | -1 | 4 | 1.00 | 0.9320 | 0 |
| STEM | 119 | 0.87 | 1.49 | 0.14 | 0.59 | 1.15 | 1 | -4 | 4 | 2.00 | 0.9362 | 0 |
| statistic | p.value | parameter | method |
|---|---|---|---|
| 83.07665 | 0 | 6 | Kruskal-Wallis rank sum test |
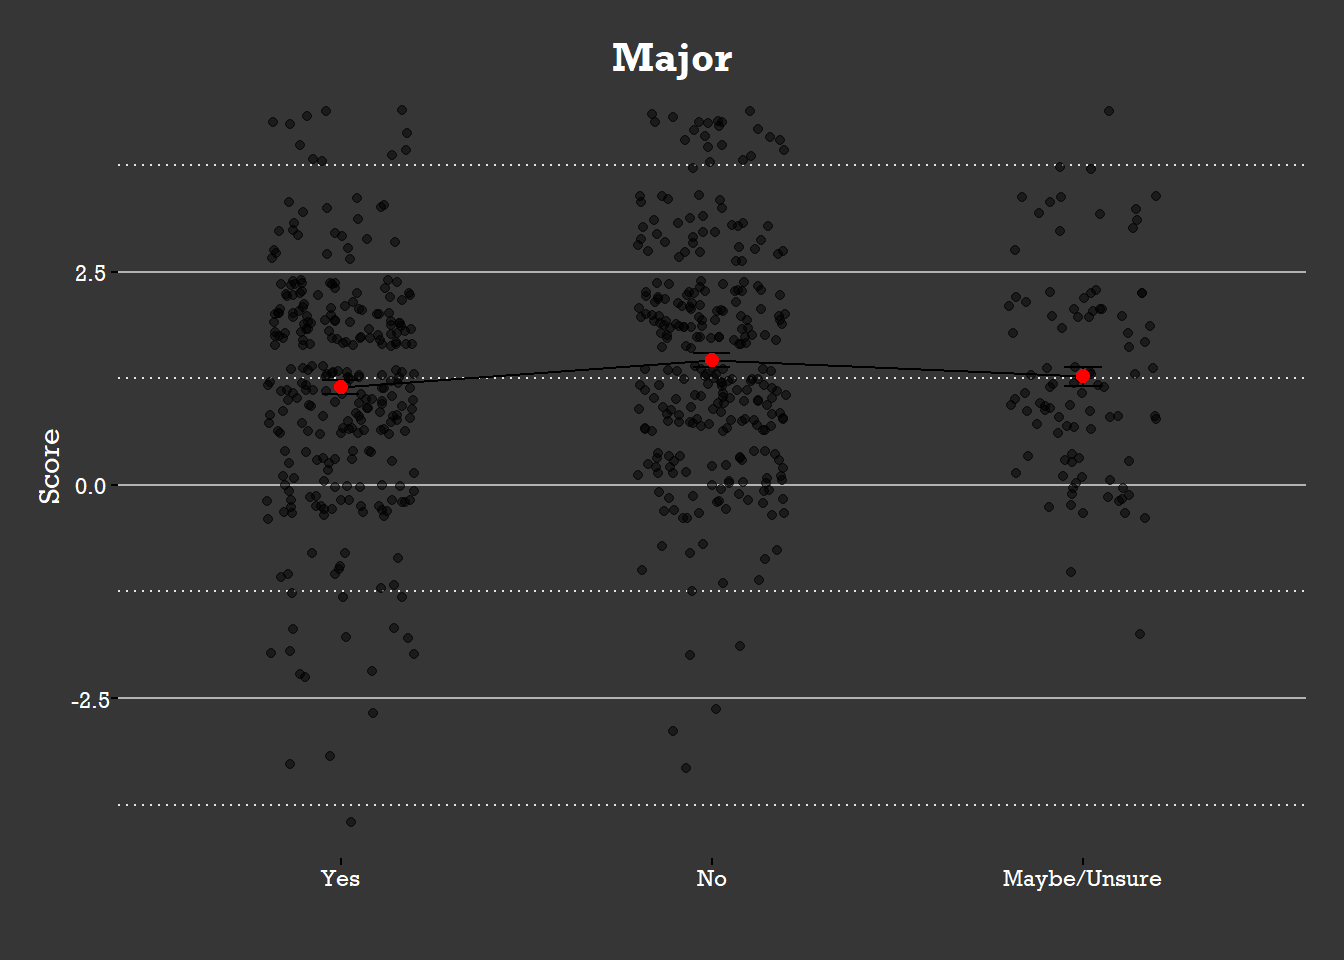
| STEM? | n | mean | sd | stderr | LCL | UCL | median | min | max | IQR | W.Stat | p.value |
|---|---|---|---|---|---|---|---|---|---|---|---|---|
| Maybe/Unsure | 96 | 1.27 | 1.14 | 0.12 | 1.03 | 1.51 | 1 | -2 | 4 | 2 | 0.9200 | 0 |
| No | 278 | 1.46 | 1.36 | 0.08 | 1.30 | 1.62 | 1 | -3 | 4 | 1 | 0.9382 | 0 |
| Yes | 283 | 1.15 | 1.37 | 0.08 | 0.99 | 1.31 | 1 | -4 | 4 | 2 | 0.9266 | 0 |
| statistic | p.value | parameter | method |
|---|---|---|---|
| 5.83066 | 0.0541861 | 2 | Kruskal-Wallis rank sum test |
| x | |
|---|---|
| Cramer V | 0.2753 |
| x | |
|---|---|
| Cramer V | 0.1692 |
| x | |
|---|---|
| Cramer V | 0.2047 |

## Warning in chisq.test(r$fulfilled, r$overall_satisfied): Chi-squared
## approximation may be incorrect| statistic | p.value | parameter | method |
|---|---|---|---|
| 305.6472 | 0 | 24 | Pearson’s Chi-squared test |
| full | sat | n |
|---|---|---|
| Less fulfilled | Extremely Satisfied | 8 |
| Less fulfilled | Less satisfied | 101 |
| Less fulfilled | Moderately Satisfied | 117 |
| Less fulfilled | Slightly Satisfied | 59 |
| More fulfilled | Extremely Satisfied | 90 |
| More fulfilled | Less satisfied | 30 |
| More fulfilled | Moderately Satisfied | 193 |
| More fulfilled | Slightly Satisfied | 41 |
| x | |
|---|---|
| Cramer V | 0.4386 |
| statistic | p.value | parameter | method |
|---|---|---|---|
| 122.9483 | 0 | 3 | Pearson’s Chi-squared test |
##
## Re-fitting to get Hessian| term | estimate | std.error | statistic | coef.type |
|---|---|---|---|---|
| as.factor(full)More fulfilled | -0.3760647 | 0.1478358 | -2.543799 | coefficient |
| Extremely Satisfied|Less satisfied | -1.9096138 | 0.1367454 | -13.964735 | scale |
| Less satisfied|Moderately Satisfied | -0.7809734 | 0.1147056 | -6.808505 | scale |
| Moderately Satisfied|Slightly Satisfied | 1.4836493 | 0.1334414 | 11.118355 | scale |