Methods
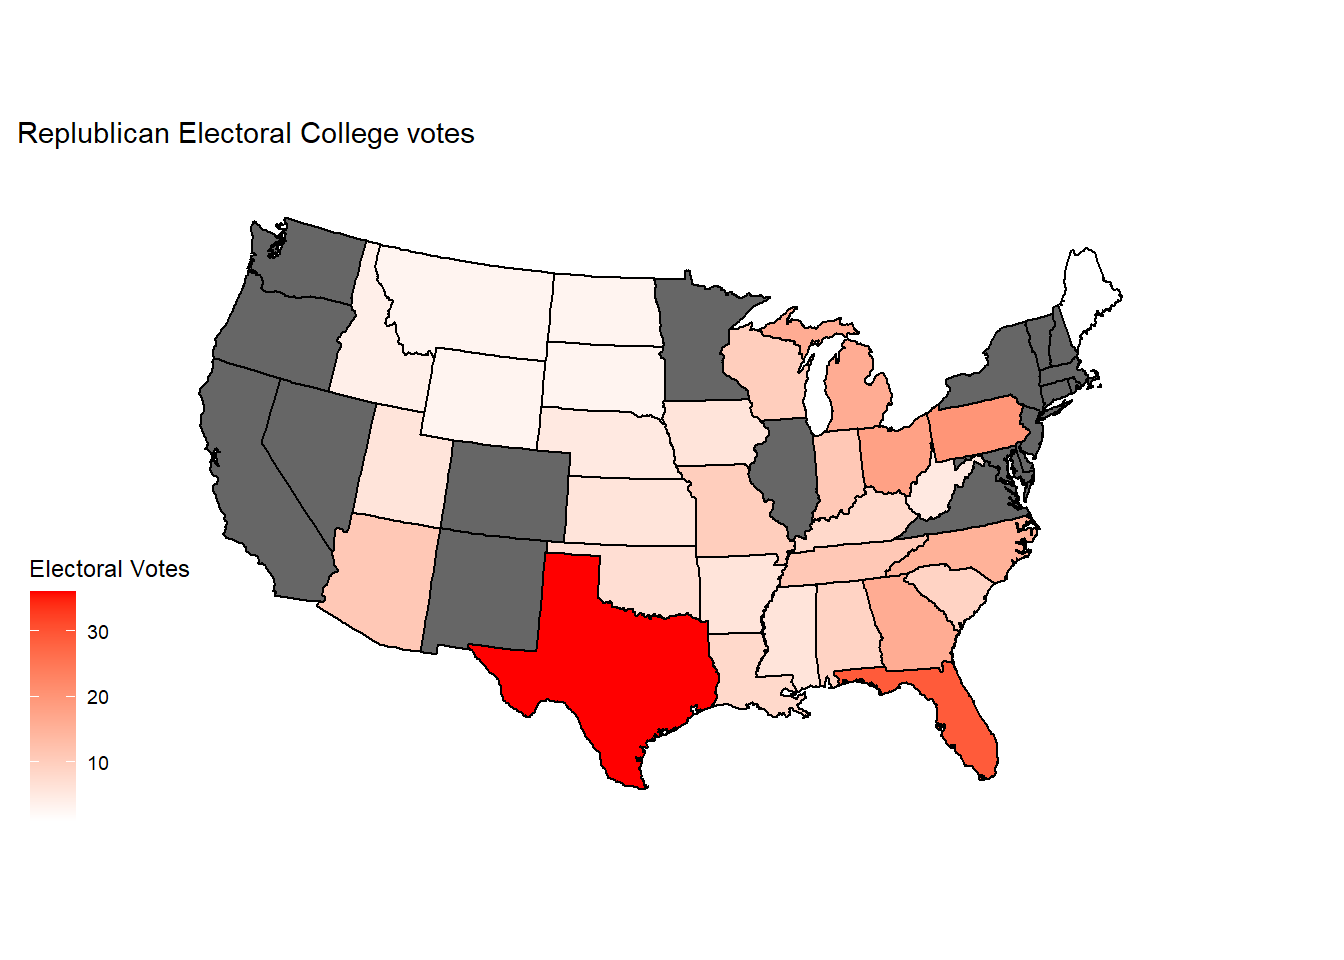
ggplot(state_elec, aes(x = long, y = lat, group = group, fill = repev)) +
  geom_polygon(color = "black") +
  coord_map(projection = "albers", lat0 = 39, lat1 = 45) +
  scale_fill_gradient(low = "white",
                       high = "red",
                       na.value = "grey40"
                       ) +
  theme_map() +
  ggtitle("Replublican Electoral College votes") +
  labs(fill = "Electoral Votes")
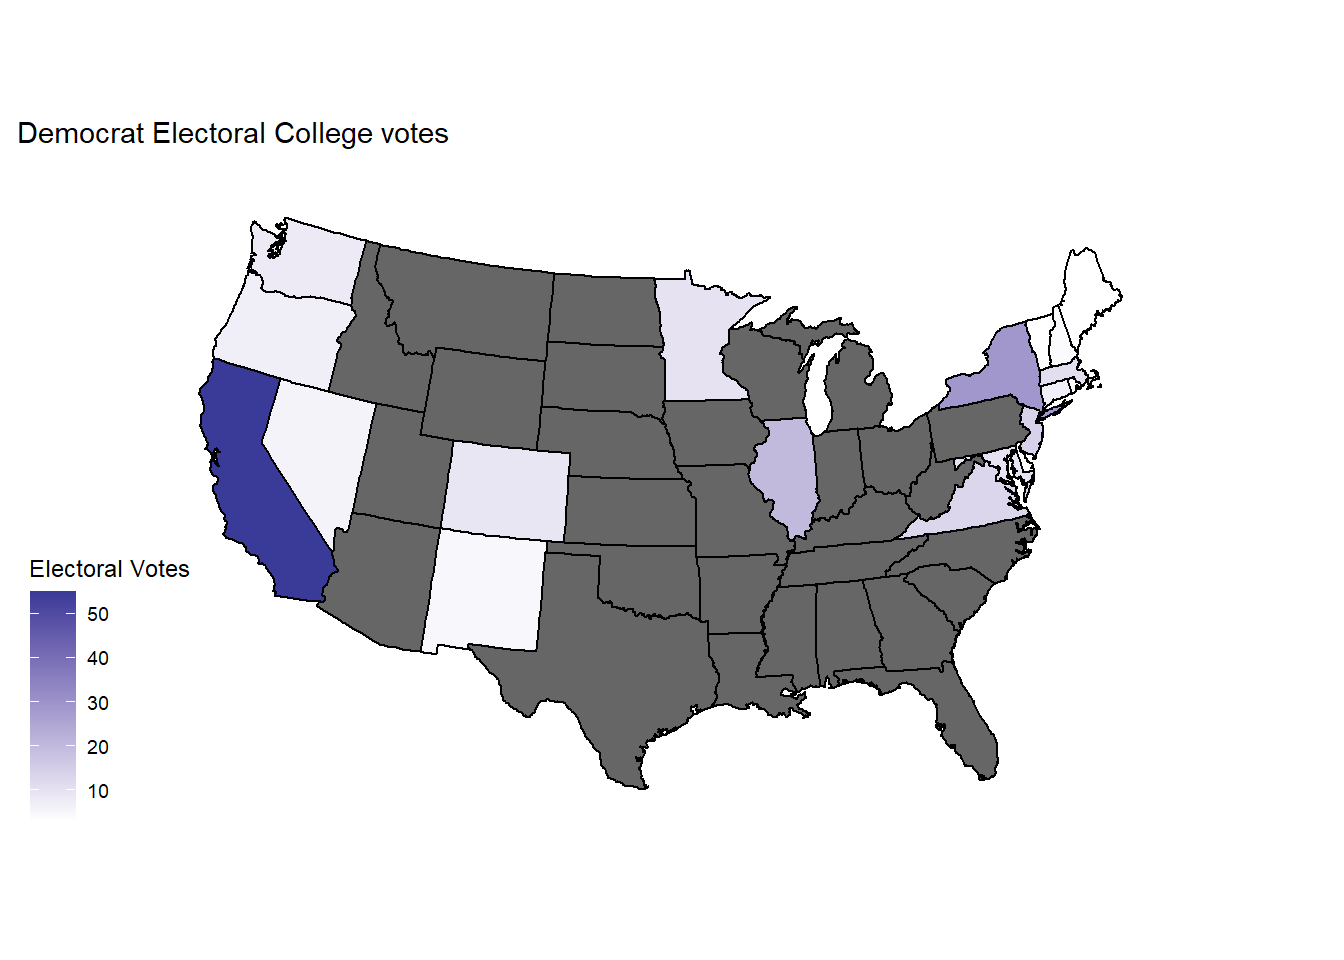
ggplot(state_elec, aes(x = long, y = lat, group = group, fill = demev)) +
  geom_polygon(color = "black") +
  coord_map(projection = "albers", lat0 = 39, lat1 = 45) +
  scale_fill_gradient(low = "white",
                      high = muted("blue"),
                      na.value = "grey40"
  ) +
  theme_map() +
  ggtitle("Democrat Electoral College votes") +
  labs(fill = "Electoral Votes")
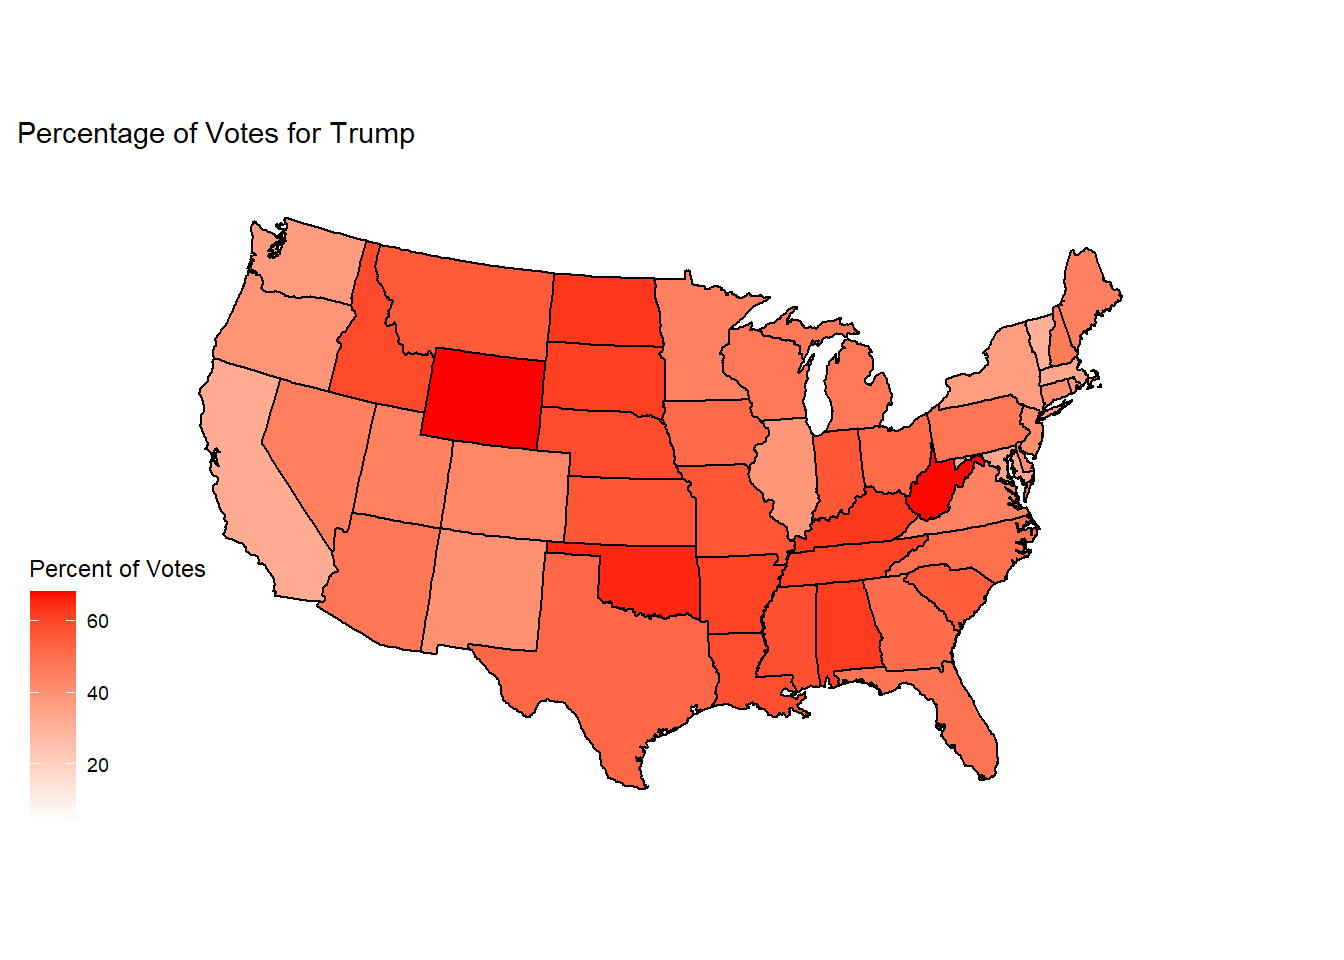
ggplot(state_elec, aes(x = long, y = lat, group = group, fill = pct_trump)) +
  geom_polygon(color = "black") +
  coord_map(projection = "albers", lat0 = 39, lat1 = 45) +
  scale_fill_gradient(low = "white",
                      high = "red") +
  theme_map() +
  ggtitle("Percentage of Votes for Trump") +
  labs(fill = "Percent of Votes")
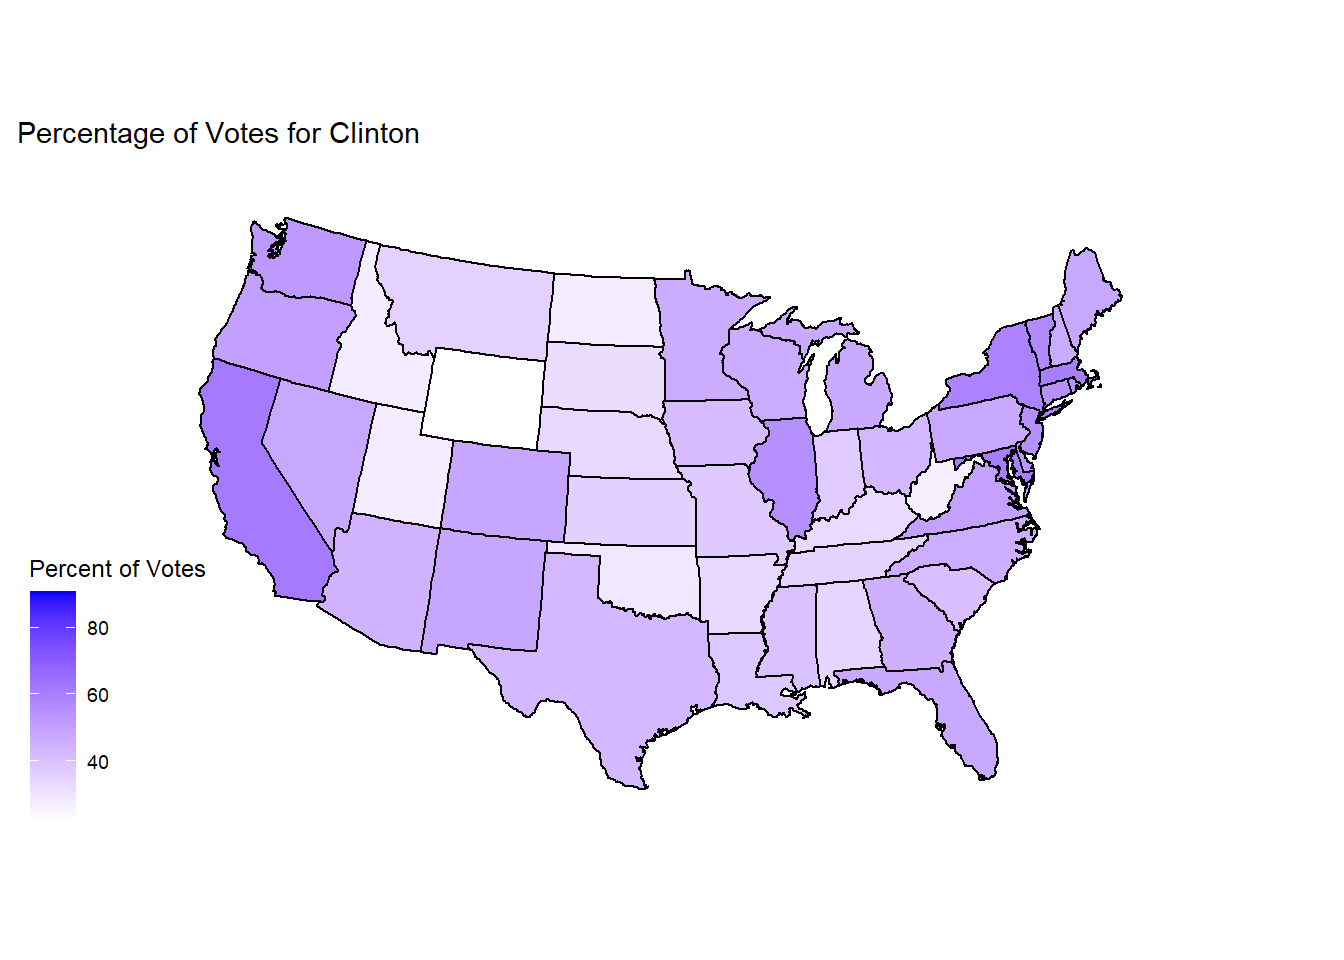
ggplot(state_elec, aes(x = long, y = lat, group = group, fill = pct_clinton)) +
  geom_polygon(color = "black") +
  coord_map(projection = "albers", lat0 = 39, lat1 = 45) +
  scale_fill_gradient(low = "white",
                      high = "blue") +
  theme_map() +
  ggtitle("Percentage of Votes for Clinton") +
  labs(fill = "Percent of Votes")
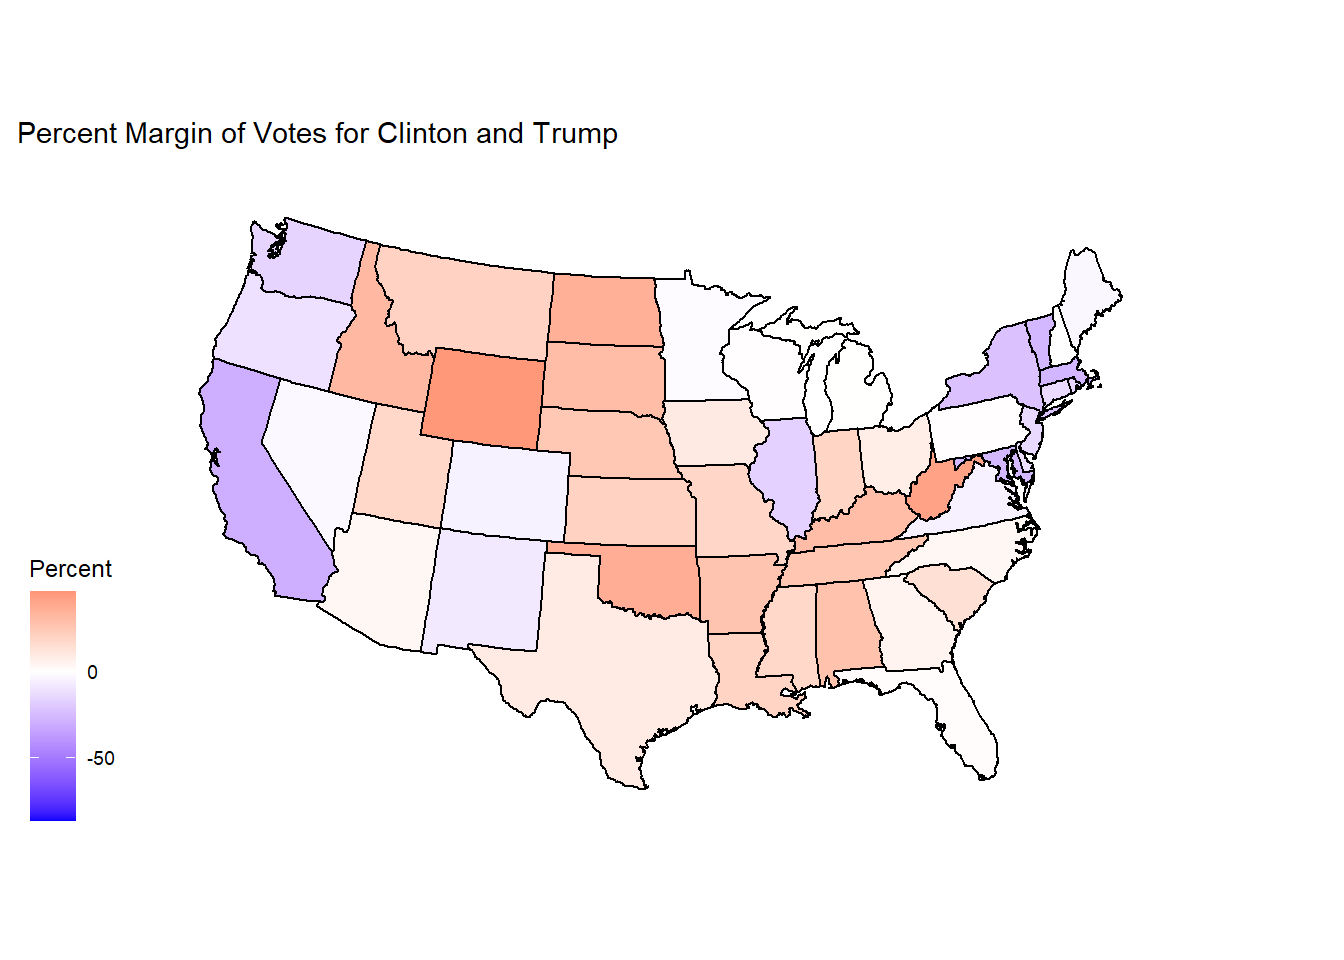
ggplot(state_elec, aes(x = long, y = lat, group = group, fill = r_points)) +
  geom_polygon(color = "black") +
  coord_map(projection = "albers", lat0 = 39, lat1 = 45) +
  scale_fill_gradient2(low = "blue",
                       mid = "white",
                      high = "red",
                      midpoint = 0) +
  theme_map() +
  ggtitle("Percent Margin of Votes for Clinton and Trump") +
  labs(fill = "Percent")
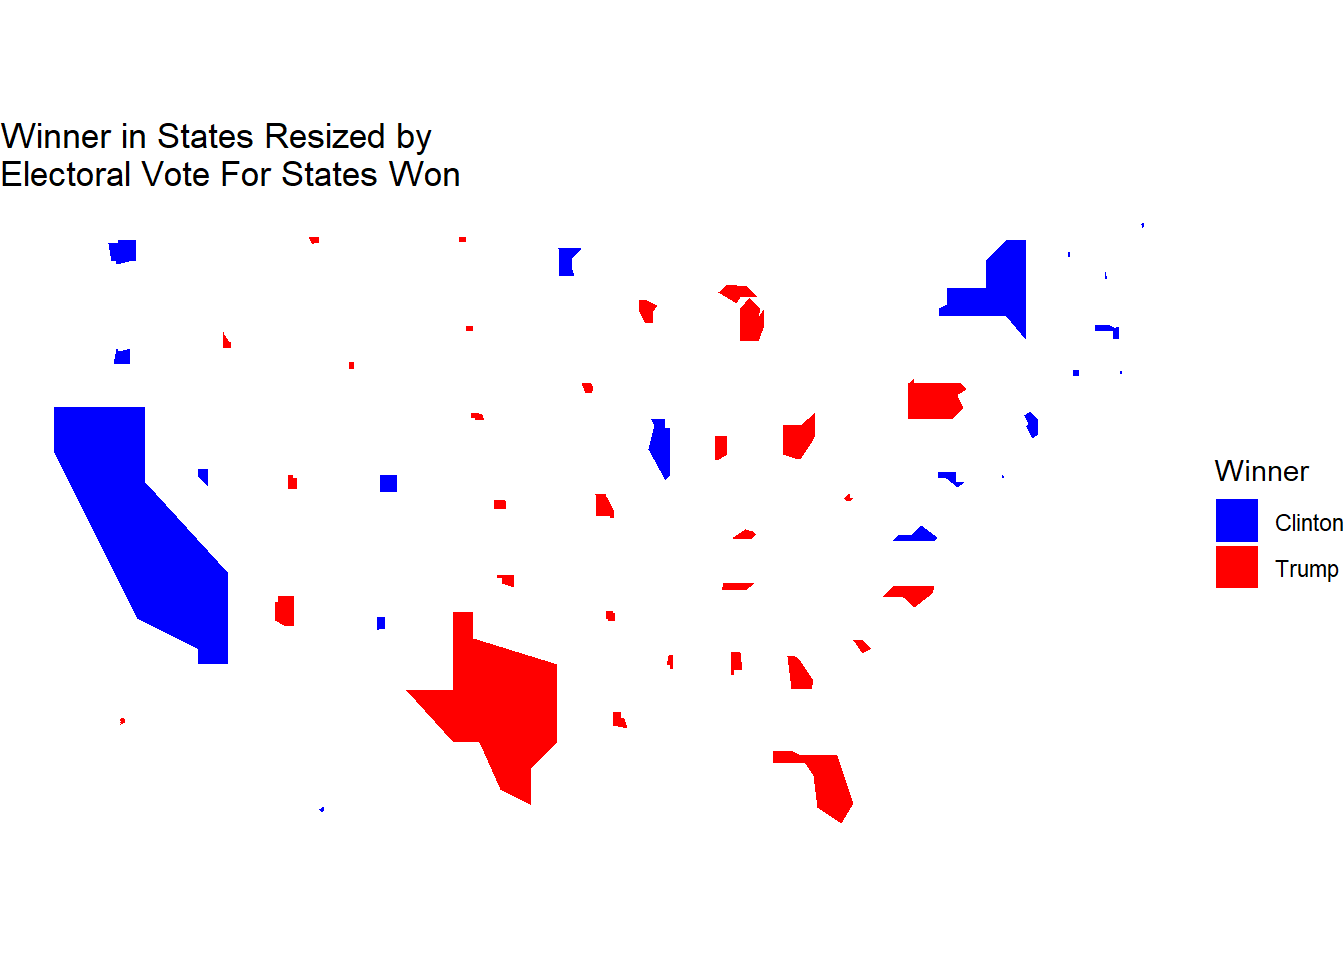
ggplot(rescaledByEC, aes(long, lat, group = group, fill = winner)) +
geom_polygon(aes(longscale, latscale)) +
coord_fixed() +
theme_void() +
scale_fill_manual(values = c("blue", "red")) +
labs(title = str_wrap("Winner in States Resized by Electoral Vote For States Won", 30),
fill = "Winner")
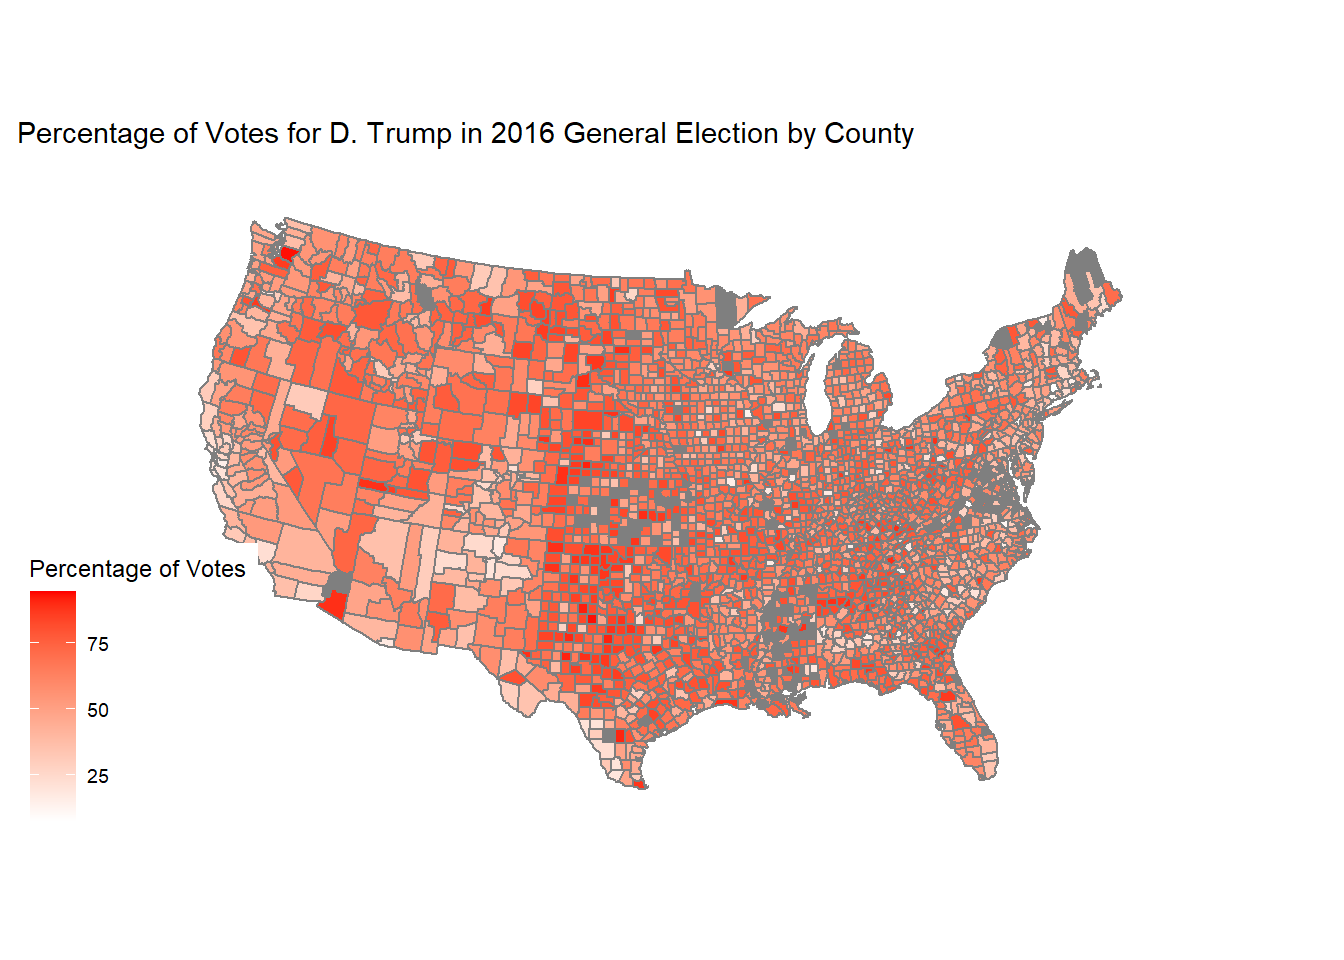
ggplot(c16map2, aes(long, lat, group = group, fill = pct_trump)) +
  geom_polygon(color = "gray50") +
  labs(fill = "Percentage of Votes") +
  theme_map() +
  coord_map(projection = "albers", lat0 = 39, lat1 = 45) +
  scale_fill_gradient(low = "white",
                     high = "red",
                     na.value = "gray50") +
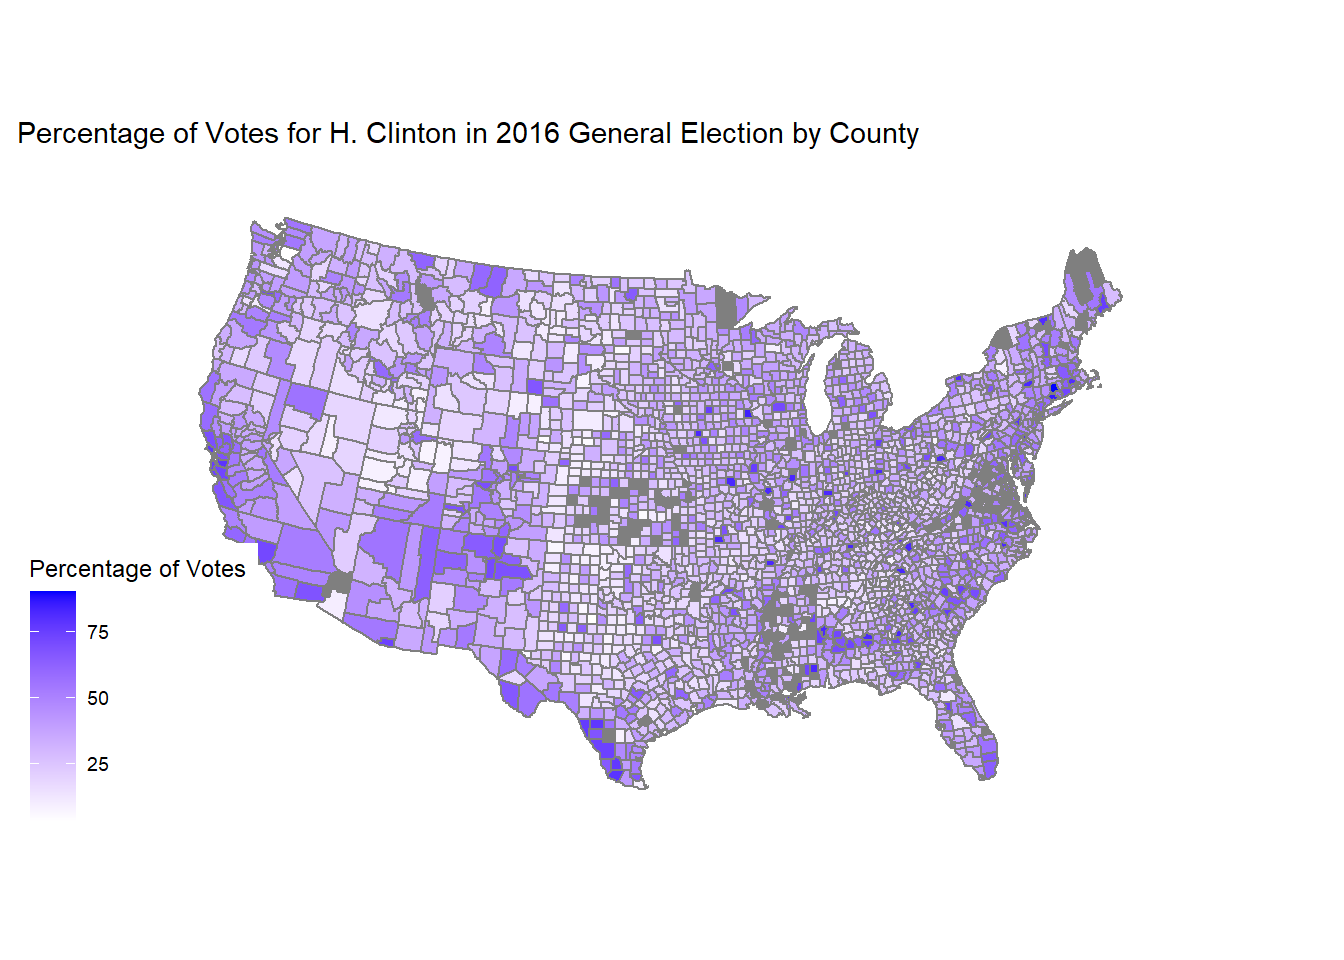
  ggtitle("Percentage of Votes for D. Trump in 2016 General Election by County")
ggplot(c16map2, aes(long, lat, group = group, fill = pct_clinton)) +
  geom_polygon(color = "gray50") +
  labs(fill = "Percentage of Votes") +
  theme_map() +
  coord_map(projection = "albers", lat0 = 39, lat1 = 45) +
  scale_fill_gradient(low = "white",
                     high = "blue",
                     na.value = "gray50") +
  ggtitle("Percentage of Votes for H. Clinton in 2016 General Election by County")
